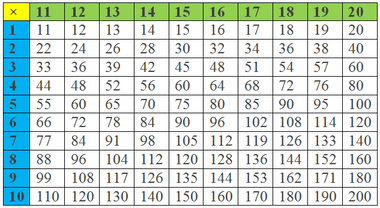
A multiplication chart,
also known as a times table or multiplication table, is a visual tool that
displays the products of numbers from 1 to a certain range, typically up to 10
or 12. It is organized in a grid format with the numbers listed along the top
and left sides. The chart shows the results of multiplying the numbers in each
row with the numbers in each column, resulting in a grid of multiplication
facts. Each cell in the chart represents the product of the corresponding row
and column numbers.
For example, in a multiplication chart that goes up to 10, the
number 3 in the first row and the number 4 in the first column intersect at the
cell containing the number 12. This indicates that 3 multiplied by 4 equals 12.
Similarly, the chart provides the products for all possible combinations of
numbers within the given range.
********************
10 Math Problems officially announces the release of Quick Math Solver and 10 Math Problems, Apps on Google Play Store for students around the world.
********************
********************
A multiplication chart is a helpful tool for students learning
multiplication as it provides a clear and organized representation of the
multiplication facts. It allows students to quickly find the product of two
numbers by locating the corresponding cell in the chart. The chart also reveals
patterns and relationships between numbers, aiding in the understanding of
multiplication concepts and facilitating the memorization of multiplication facts.
By regularly referring to the multiplication chart, students can
reinforce their knowledge of multiplication, improve fact fluency, and develop
a strong foundation for more complex mathematical operations.
Multiplication Chart
1 - 10

Multiplication Chart
11 – 20

Benefits of the
Multiplication Chart:
1. Visual Representation: The
chart offers a visual representation of multiplication, allowing students to
see the relationship between numbers and their products. This visual aid
enhances comprehension and makes abstract concepts more tangible.
2. Pattern Recognition: The
multiplication chart reveals numerous patterns and symmetries. For instance,
multiples of the same number form diagonal lines across the chart. Recognizing
these patterns helps students identify relationships and develop mental
shortcuts for solving multiplication problems efficiently.
3. Memorization Aid: The
chart serves as a valuable tool for memorizing multiplication facts. By
regularly referring to the chart, students reinforce their knowledge of
multiplication, gradually reducing their reliance on it as they internalize the
facts.
4. Multiplication Strategies:
The chart supports the development of multiplication strategies, such as skip
counting, grouping, and repeated addition. These strategies enable students to
approach multiplication problems from different angles, fostering a deeper
understanding of the concept.
Applications in
Education:
1. Introduction to Multiplication: The multiplication chart is often introduced to students at an
early stage of their mathematical journey. By exploring the chart, young
learners grasp the concept of multiplication, observe number patterns, and
develop a solid foundation for future mathematical concepts.
2. Fact Fluency:
Mastering multiplication facts is essential for more complex mathematical
operations. The chart helps students build fluency by providing a visual
reference and promoting regular practice.
3. Mental Math Skills: The
multiplication chart aids in mental math development. By internalizing the
chart's patterns, students can quickly recall multiplication facts and perform
mental calculations with ease.
4. Problem-Solving: The
chart expands students' problem-solving capabilities. By identifying patterns
and making connections, learners gain the ability to apply multiplication
strategies to real-world scenarios and mathematical puzzles.
5. Multiplicative Reasoning:
Through the exploration of the chart, students develop multiplicative reasoning
skills, enabling them to understand the relationship between multiplication,
division, factors, and multiples.
Teaching Strategies:
Educators can employ various strategies to maximize the benefits
of the multiplication chart:
1. Interactive Exploration:
Encourage students to actively engage with the multiplication chart by
exploring the patterns and discussing their observations. This interactive
approach fosters critical thinking and mathematical discourse.
2. Hands-On Activities:
Incorporate hands-on activities that involve manipulating the chart, such as
highlighting specific number patterns or filling in missing values. These
activities promote a deeper understanding of multiplication concepts.
3. Game-Based Learning: Utilize
educational games and puzzles that incorporate the multiplication chart. These
interactive and engaging activities make learning multiplication enjoyable
while reinforcing conceptual understanding.
4. Gradual Fade: As
students become more proficient in multiplication, gradually reduce their
reliance on the chart. Encourage mental calculations and challenge them to
recall multiplication facts from memory.
Conclusion:
A multiplication chart is a powerful tool that facilitates the understanding, mastery, and application of multiplication. Its visual representation, pattern recognition, and support for mental math skills make it an invaluable asset in mathematics education. By leveraging the benefits of the multiplication chart, educators can empower students to develop a strong foundation in multiplication, laying the groundwork for success in higher-level mathematics and problem-solving.


0 comments: